Analysing My 8hr 38min 100km Run
I had an amazing run at the Trail Trilogy 100km ultramarathon. Overall, I am incredibly happy with my effort and I am glad I implemented my 19-1 run-walk strategy, which I believe saved me on multiple occasions. HOWEVER, I felt like everything went to plan except for two sections. Looking back through my data, those two sections do stick out at me and I’d like to show them to you.
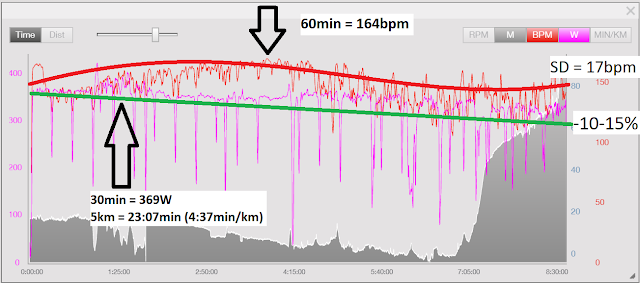
Here is the raw output from TrainingPeaks, the software I use to analyse training files. To the untrained eye, it may look like a bit of a mess, but with a little background information, you can unlock a world of information. I’ll show you.
First, if you clear out some of the excess data and only show heart rate and running power, you can see that I slowed down over the duration of the race.
The rate at which I slowed down fits nicely into the results published in a 2004 study titled “Changes in Running Speeds in a 100 km Ultramarathon Race” (read here).
The researchers showed that faster runners slow down the least (avg 15%) and slow down later (50 km onwards) when compared with slower runners who slow down from 30 km and decrease their speed by up to 30%.
The 50 km point was where I too began to slow down. Up until 50 km I was averaging 4:54 min/km (346 W), but from 50-70 km, I averaged 5:08 min/km (331 W), and from 70 km onwards, I slowed considerably, averaging 5:37 min/km (305 W) for the remaining 30 km to the finish. Granted, the last 30 km was the uphill section of the course (grey part of the graph), but my power was still 13.5% lower over the final 30 km when compared with the first 50 km.
The fact that my results fit within the published observations of ultramarathoners shows why am ecstatic with how the race played out. We all know things can go very wrong in an ultramarathon!
Patience. In the two sections I outlined, I remember thinking “If I slow down I’ll lose time”. Although I was able to slow myself after my “fast” 5 km, I could have been more reserved when I started to see my heart rate climb toward 170 bpm.
We all slow down during an ultramarathon. That means the small things we do to try and “gain time” early are potentially costing us valuable energy that could be used later in the race.
Here is the raw output from TrainingPeaks, the software I use to analyse training files. To the untrained eye, it may look like a bit of a mess, but with a little background information, you can unlock a world of information. I’ll show you.
Everyone slows down in an ultra
First, if you clear out some of the excess data and only show heart rate and running power, you can see that I slowed down over the duration of the race.
The rate at which I slowed down fits nicely into the results published in a 2004 study titled “Changes in Running Speeds in a 100 km Ultramarathon Race” (read here).
The researchers showed that faster runners slow down the least (avg 15%) and slow down later (50 km onwards) when compared with slower runners who slow down from 30 km and decrease their speed by up to 30%.
I slowed by 13%
The 50 km point was where I too began to slow down. Up until 50 km I was averaging 4:54 min/km (346 W), but from 50-70 km, I averaged 5:08 min/km (331 W), and from 70 km onwards, I slowed considerably, averaging 5:37 min/km (305 W) for the remaining 30 km to the finish. Granted, the last 30 km was the uphill section of the course (grey part of the graph), but my power was still 13.5% lower over the final 30 km when compared with the first 50 km.
The fact that my results fit within the published observations of ultramarathoners shows why am ecstatic with how the race played out. We all know things can go very wrong in an ultramarathon!
So where are the two sections that I think I went wrong?
#1
After about an hour, I sped up a bit. You’ll see my peak 30 min power and peak 5 km were achieved at 1hr30min. I remember thinking, “this feels a little fast” and I was right on the upper limit of my power zone, so I made a point of slowing after my next walking break. Run-walk to the rescue again!! Although only a small blip, it was quite early in the race and that can, and potentially did, have a big follow-on effect later down the track.#2
My high heart rate from 3-4 hrs (40-50 km). After 3 hrs I started getting into the 160 bpm range which is the upper limit of what is sustainable for me (aerobic threshold). However, despite the high heart rate and feeling like I was working slightly harder than I should be, my power was in the right zone and I had the knowledge that during my 6 hr simulation run, I averaged 161 bpm for the last 3 hrs and felt fine. With that in mind, I justified pushing on rather than slowing to get my heart rate under 160 bpm. By 60 km I was forced to bring my heart rate back back under 160 bpm due to being unable to push any further.What would I do differently next time?
Patience. In the two sections I outlined, I remember thinking “If I slow down I’ll lose time”. Although I was able to slow myself after my “fast” 5 km, I could have been more reserved when I started to see my heart rate climb toward 170 bpm.
Key takeaway
We all slow down during an ultramarathon. That means the small things we do to try and “gain time” early are potentially costing us valuable energy that could be used later in the race.


Six decks are used and shuffled after every 1xbet spherical of our commonplace blackjack recreation. In all of the blackjack games available at Ignition Casino, blackjacks pay 3-2. As we outlined above, we have to ask the player whether they'd like to hit or keep, and continue to ask them until they bust, or they resolve to stay. One piece of knowledge that's essential to the player's decision is their present tally, therefore, we print the player's hand and present tally every time before asking for their response. If the player and the dealer each do not bust, whoever is closest to 21 wins. Stadiums can offer digital versions of many games, reducing costs for each the on line casino and the players.
ReplyDelete